Layout Selection Strategy
Once we’ve detected a variety of layouts, the next step involves selecting the most suitable layout for each identified group. This decision is guided by a set of criteria:
Selection Criteria
Aspect Ratio Alignment
Each group comprises objects with known aspect ratios, determined from their bounding boxes. Our goal is to emphasize these objects over the entire image, necessitating a layout that optimally accommodates their dimensions.
To accomplish this, the goal is to find a layout with an aspect ratio distribution of rectangles that closely aligns with that of the group’s objects. This involves calculating and comparing aspect ratio distributions for both layouts and groups, selecting the layout with the highest similarity in distribution.
Maximizing Object Display
Besides ensuring aspect ratio compatibility, another vital consideration is the layout’s capacity for displaying objects. The aim is to feature as many objects as possible, guiding a preference for layouts with more rectangles.
Achieving Balance
The ideal layout is one that not only shows a high degree of aspect ratio congruence but also contains a significant number of rectangles. This approach strikes a balance, enabling the exhibition of numerous objects while ensuring they are presented in an appropriate and visually appealing manner.
Computing Aspect Ratio Distributions
To evaluate the distribution of aspect ratios, we employ a histogram that segments the aspect ratios (width divided by height) of rectangles into 10 distinct bins. The range for these bins is set based on a thorough examination of the aspect ratio distribution observed across all the layouts.
Here’s a step-by-step breakdown of the process:
-
Collecting Aspect Ratios: We compile a comprehensive set of aspect ratios by collecting these measurements from all rectangles across all layouts.
-
Plotting the Distribution: The distribution of these aspect ratios is visualized to understand the overall spread.
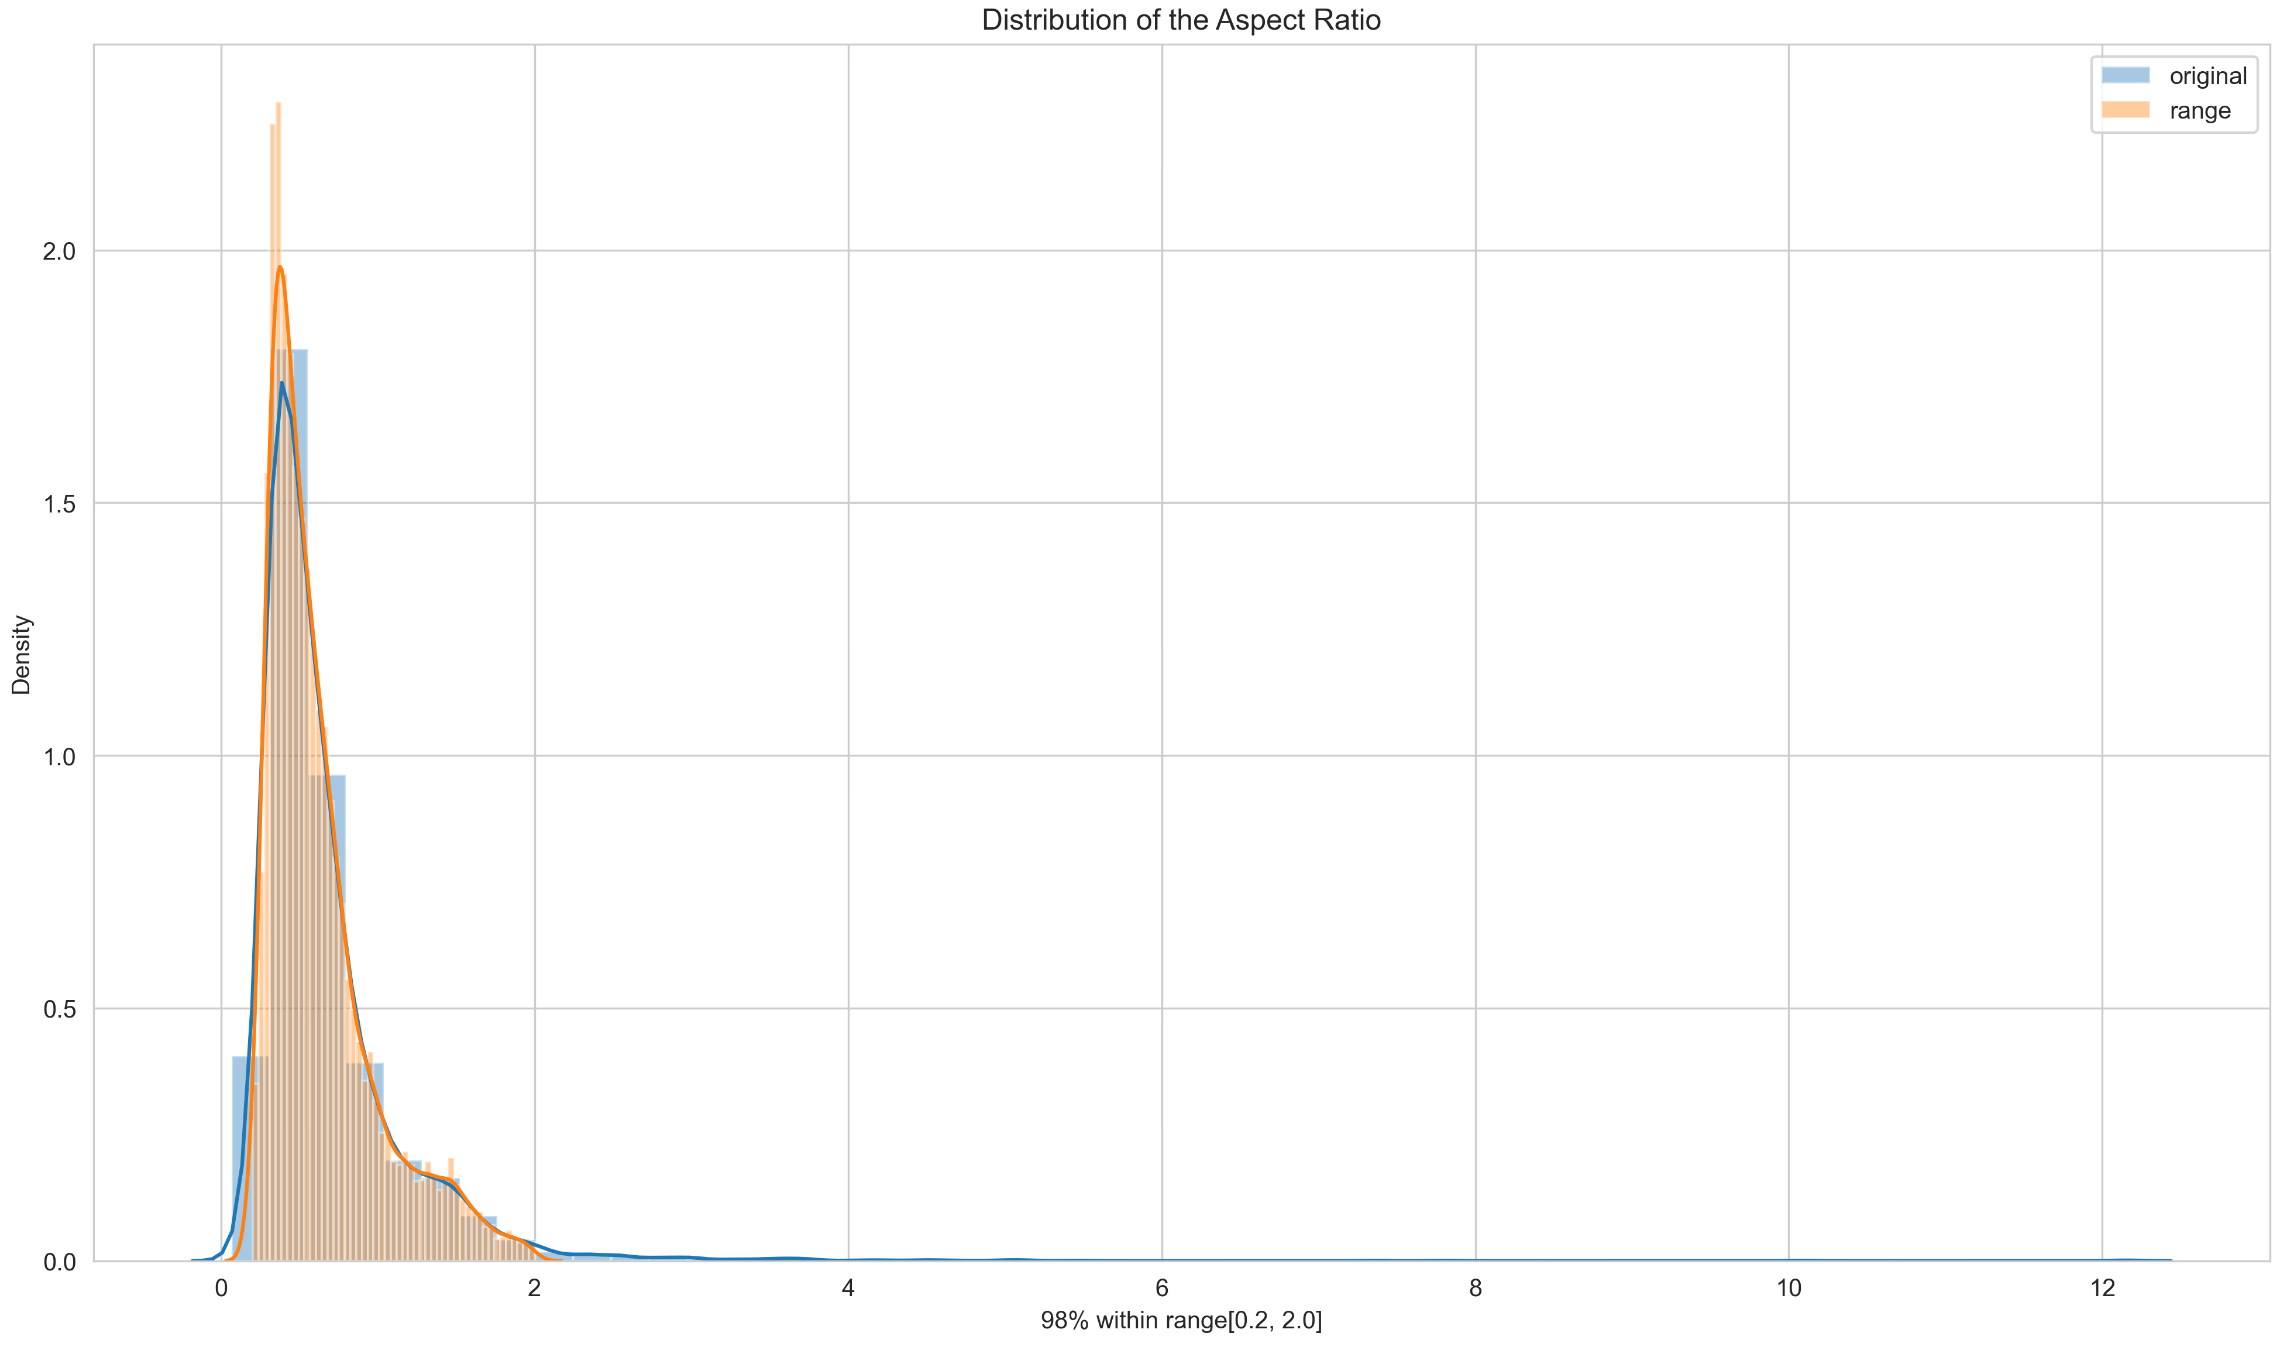
-
Determining Range: It shows that the range
[0.2, 2.0]covers approximately 98% of the aspect ratio values. Therefore, this range is chosen as the standard for evaluating the histograms across all layouts.np.histogram(ars, bins=10, range=[0.2, 2.0]) -
Normalization by Rectangle Count: To account for the varying number of rectangles in each layout, we normalize the histogram by the total count of rectangles in that particular layout.
-
Vector Representation: We represent the aspect ratio distribution of each layout as a 10-dimensional vector. In this vector, each dimension reflects the proportion of rectangles that fall within each histogram bin.
-
Normalization for Cosine Similarity: To facilitate the calculation of cosine similarity between these distributions, the vectors are further normalized by their L2 norm.
Verification
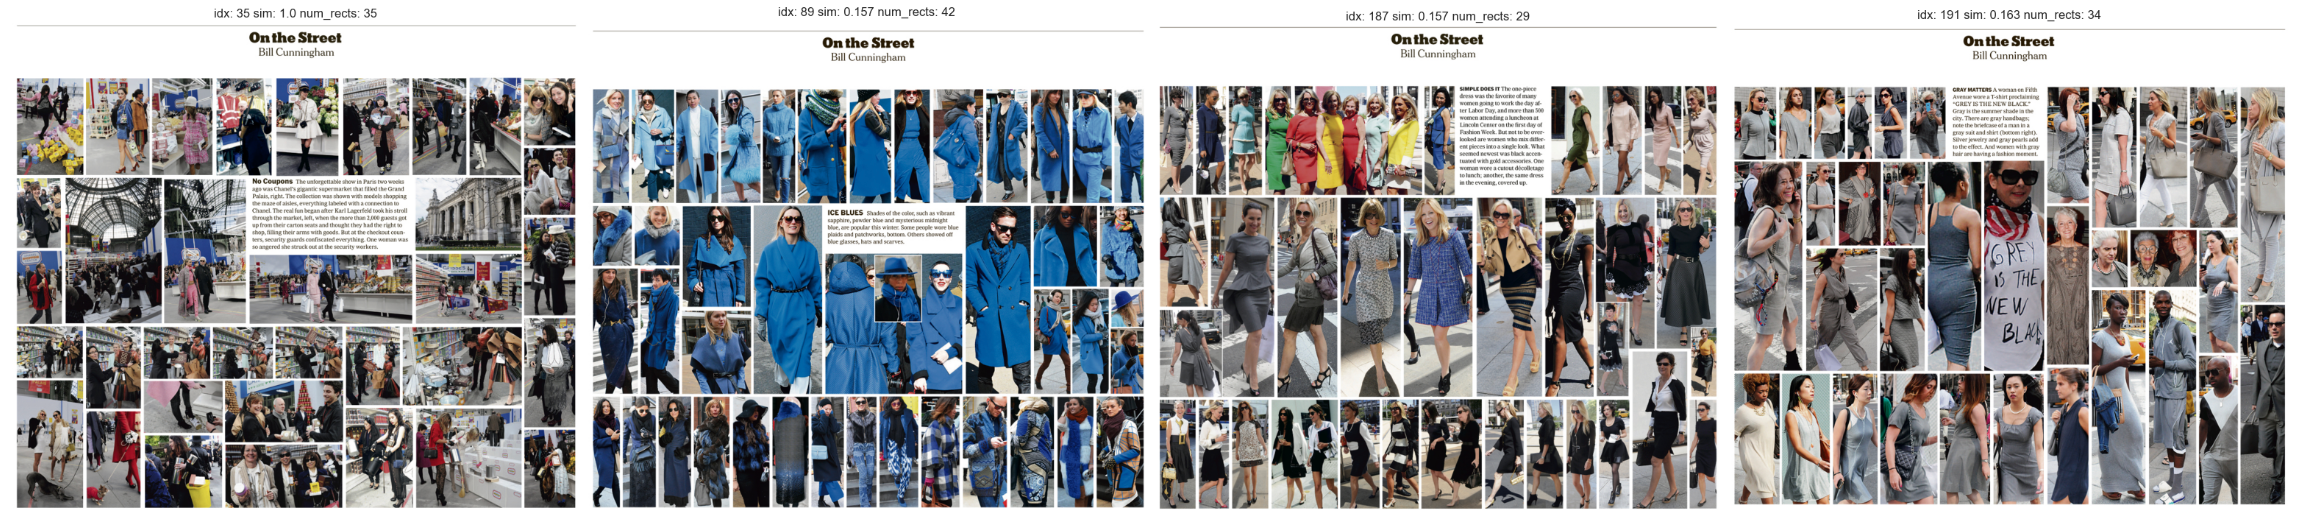
To validate our approach, we compute the pairwise cosine similarity scores between the aspect ratio distributions of different layouts. Following this, for each layout, we inspect its three most similar and three least similar layouts based on these scores.
This verification step helps in ensuring that our layout selection process is grounded in accurate similarity assessments, thereby enhancing the overall quality and relevance of our chosen layouts.
Example 1
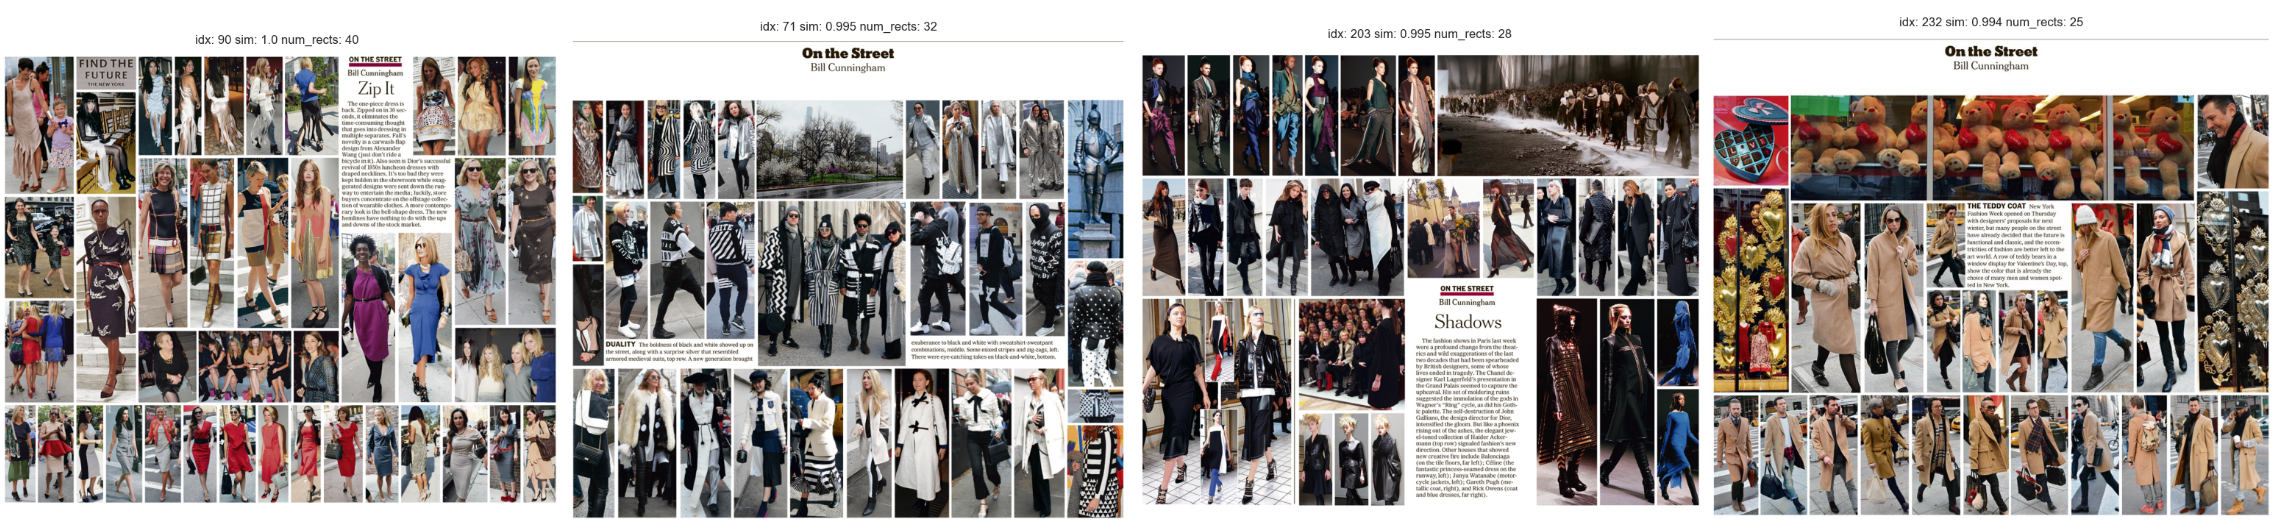
Top 3 most similar layouts (anchor layout on the first column)
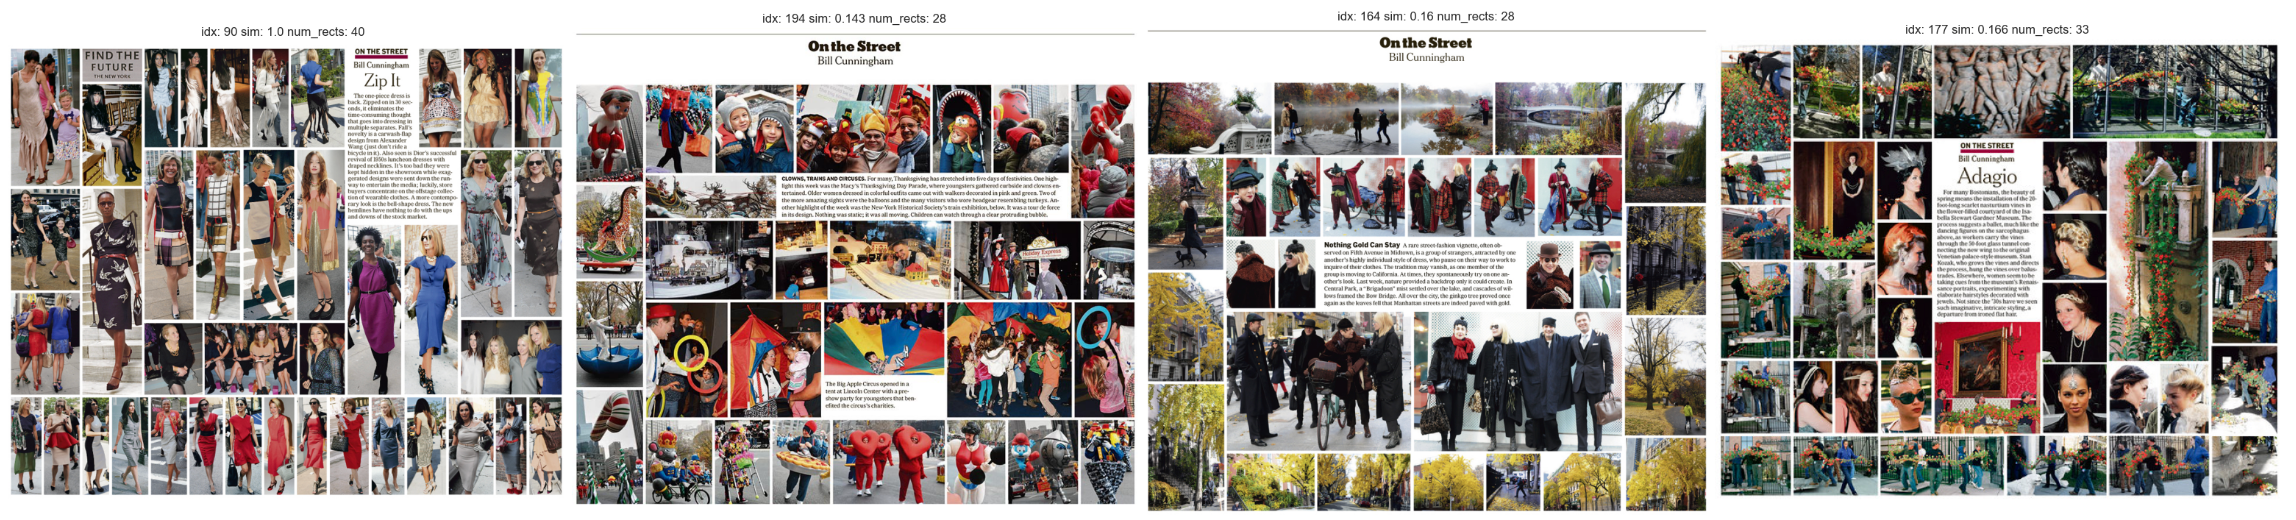
Top 3 least similar layouts (anchor layout on the first column)
Example 2
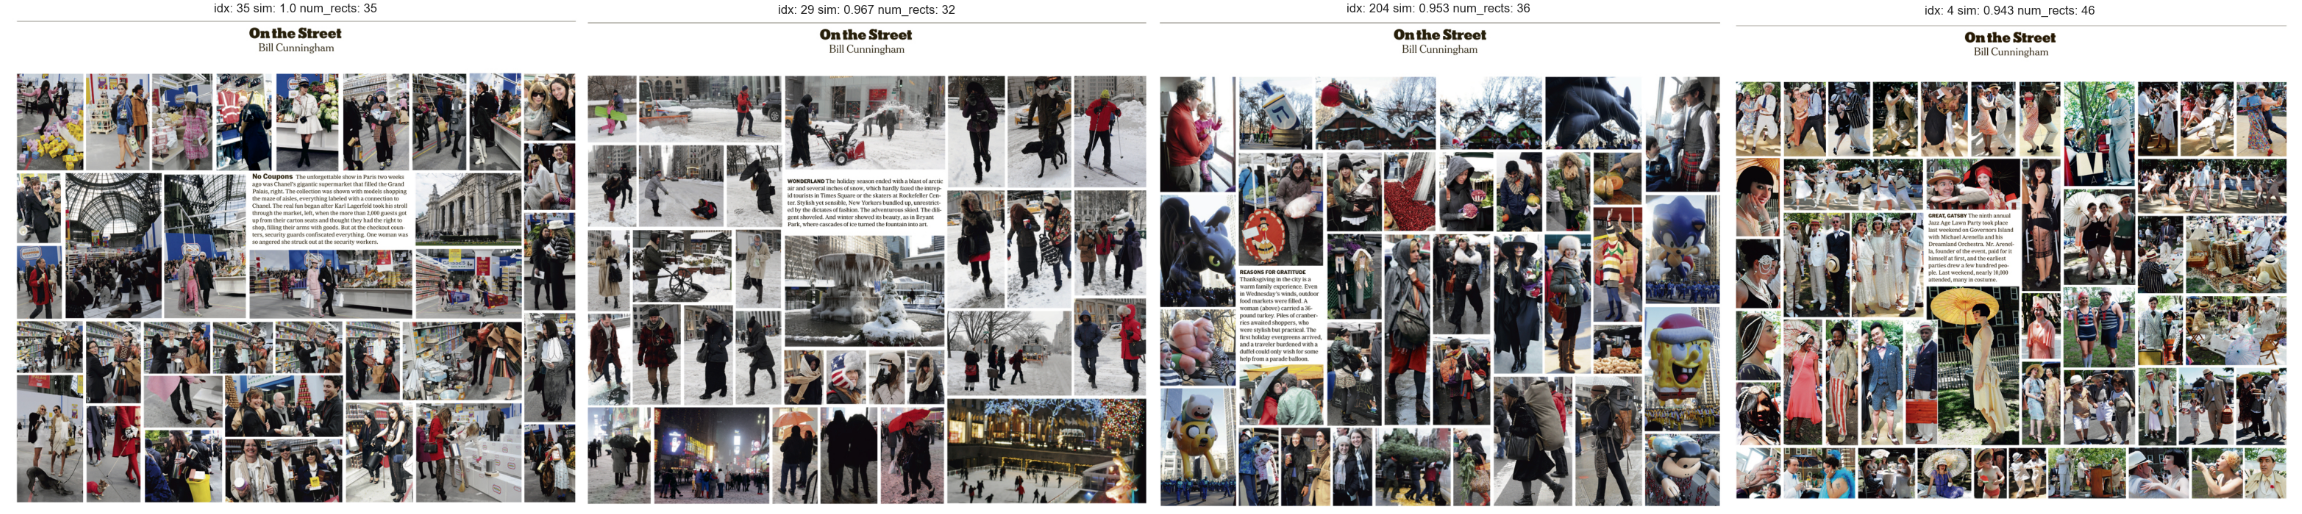
Top 3 most similar layouts (anchor layout on the first column)
Top 3 least similar layouts (anchor layout on the first column)
Implementation Details
Input
| Name | Description |
|---|---|
bill_template_processed_results.csv | The layout detection results for each poster |
bill_template_processed | A folder containing the processed posters |
Process
| Code | Description |
|---|---|
codes/poster_generation/layout_similarity.ipynb | Calculate the aspect ratio distributions for each layout |
Output
| Name | Description |
|---|---|
bill_template_processed_results_selected.json | The selected layouts and their corresponding aspect ratio distributions |
Data Sample:
{
    "img_name": "2012-06-24.jpg",
    "img_path": "bill_template/2012-06-24.jpg",
    "res_path": "bill_template_processed/2012-06-24/2012-06-24.json",
    "has_text": true,
    "num_img_rects": 33,
    "img_width": 1150,
    "img_height": 931,
    "text_content": "ON THE STREET Cunningham Sizzle With exquisite timing, a heat wave arrived on the first day of summer, and stylish New Yorkers didn\u2019t miss a beat. Anestimated 14,000 yoga enthusiasts paved Broadway from 42nd Street to 48th Street with their bodies to mark the solstice. Men went to work in white linen suits or dark suits with Bermuda shorts, Many women observed \u2018Summer's start with crisp sleeveless white dresses or openwork embroideries and fabrics.",
    "img_rects_adjusted": [[7, 7, 126, 289], [803, 753, 998, 924]],
    "text_rect_adjusted": [430, 32, 648, 310],
    "ar_dist_normed": [0.6405126152203485, 0.7472647177570734, 0.16012815380508713, 0.05337605126836238, 0.0, 0.05337605126836238, 0.0, 0.0, 0.0, 0.0]
}